Product Service Design
Good design, from a marketing perspective, means tailoring your product or service so that it successfully meets the needs of your target customers. A sales-oriented organization "sells what they make;" a marketing-oriented organization "makes what will sell." The difference between the two is design.
In this chapter you will learn how to systematically evaluate your design compared with those of your competitors and how to determine the ways you can make the design of your product or service more attractive to your target customers.
Design and Customers
In a sales-oriented organization, the product or service is developed with minimal attention paid to the needs of the customer in the target market. Consequently, a lot of sales effort is typically needed to sell the product or service if, in fact, it can be sold at all.
In a marketing-oriented organization, before the product or service is developed, information on customer needs is gathered from the customers themselves. Then the product or service is designed to meet those needs.
Knowing What Your Customers Want
There was a very high-end table customer who used to visit a casino in Atlantic City on junkets—private flights that are scheduled for customers who usually stay overnight. He would spend as much time in the casino as possible, often taking only a quick break for a meal before he returned to the gaming floor. He was always booked into one of most luxurious suites in the hotel when he came to visit, and no expense was spared to make him feel welcome. So the management of the property was surprised and concerned when he started taking his business to a competitor in Atlantic City. After several meetings between the player development staff, casino and hotel operations, and the food and beverage managers, none of the executives could identify anything that could have caused this valuable customer to defect. So they finally decided to ask him, and they were shocked by the response.
The customer explained that he didn't get to Atlantic City very often, and when he did, he came to play. So while he appreciated the luxurious suite, he felt that it was wasted on him because he really only used the suite to grab a couple of hours of sleep, take a shower, and then return to the casino. And while the suite was wonderful, and the view was incredible, and fresh flowers in the room were a welcoming touch, what he really wanted were just two things— a comfortable bed and fluffy towels. And while he was fine with the quality of the bed, it was his opinion that the quality of the towels was inferior. So he took his considerable business to a competitor smart enough to appreciate the importance of this detail in a suite. The situation was addressed very quickly by the property, and the customer returned. And the management team learned a valuable lesson—never assume. The best way to find out what is important to customers is to ask them.
A Casino Suite.
Photo courtesy of The Trump Organization.
A Casino Suite.
Photo courtesy of The Trump Organization.
Some of the most infamous disasters in the history of marketing—Ford's Edsel, RCAs VideoDisc, Polaroid 's Polavision, Northrup 's Tigershark—all shared the same mistake: lack of attention to customer needs in the design.1 The Edsel deserves special mention. Although customer research was done, it was conducted several years before the automobile was introduced, and by then customer needs had changed. That shows how difficult marketing can be. Customers are moving targets, and product or service design must consider not only the current needs of the current customer, but the future needs of the future customer.
Determining Design
You need to bring customers into your design deliberations by considering what they expect to obtain from your product or service and comparing those expectations with what you and your competitors are currently providing. You can do that systematically with a Design Analysis (Exhibit 17.1). The steps in the process are:
• Select a target segment.
• Select a target member of the decision-making unit.
• List the main competitors.
• List the benefits associated with the product or service.
• Estimate the relative importance of each benefit to your target customer.
|
Offerings | |||||||
|
Relative |
Benefits |
Target Customers |
Competitors | ||||
|
Importance |
Sought |
Organization* |
Q |
R |
S |
T | |
|
Expected |
Actual |
Actual |
Actual |
Actual |
Actual | ||
|
9 |
Moisturizes |
5 |
3 |
4 |
2 |
5 |
1 |
|
9 |
Cleans |
5 |
4 |
2 |
3 |
2 |
5 |
|
6 |
Scent |
3 |
4 J |
2 |
3 |
4 |
1 |
|
3 |
Size |
3 |
3 |
3 |
2 |
4 |
Note: Relative importance. 1—Not important, 10—Very important Performance ratings: 1—Weak, 5—Strong Source: "Arrow Guide—Design Analysis," The Arrow Group, Ltd., New York, NY, 2008. Used here with permission. A blank version of this page can be downloaded from www.trumpuniversity.com/marketing101 and customized for your personal use. For any other use, contact Don Sexton at Marketing101@ thearrowgroup.com. Possible Design Gap Note: Relative importance. 1—Not important, 10—Very important Performance ratings: 1—Weak, 5—Strong Source: "Arrow Guide—Design Analysis," The Arrow Group, Ltd., New York, NY, 2008. Used here with permission. A blank version of this page can be downloaded from www.trumpuniversity.com/marketing101 and customized for your personal use. For any other use, contact Don Sexton at Marketing101@ thearrowgroup.com. • Estimate the performance for each benefit expected by the target customer. • Evaluate the actual performance of your organization and each competitor on each benefit. You need to bring customers into your design deliberations by considering what they expect to obtain from your product or service and comparing those expectations with what you and your competitors are currently providing. This analysis builds on the results of an Actual Value Analysis (discussed in Chapter 6) by adding information as to what your target customer expects as regards the performance on each benefit. Design Analysis — Soap Example Suppose you have developed a soap that you would like to market to 35- to 50-year-old women. You have done some research by asking women in that age range what benefits they would like in a soap, how important they are, and on a 1 to 5 scale, how would their ideal soap score on each benefit. You have also looked at some competing brands of soap to see what they offer. Compared with the Actual Value Analysis (see Chapter 6), the new information in this analysis is what level of performance for each benefit does your target customer want and expect. These would be ideal values—what your customers hope to receive from your product or service. You find out these expectations by asking customers—either in person or through surveys. Again, all information regarding benefits, priorities, perceived values, and expected values, if at all possible, must come from the customers themselves. You can start the analysis with your own opinions, but it is very important to check your opinions with those of your customers. When a conflict occurs, use your customers' opinions. Exhibit 17.1 shows that your target customers have high expectations regarding performance of those benefits of most importance to them— moisturizes and cleans. You need to compare your actual performance with these expectations to determine whether you might be successful with this group of customers. If their expectations are different from the actual value you provide them, then there are design gaps that you may want to consider filling. For example, Exhibit 17.1 shows that your actual performance on both "moisturizes" and "cleans" falls short of the expectations of these target Product Design: LifeSavers Product design must be based on what your customers want. That's why LifeSavers candy asked consumers to vote on which flavors should be included in a five-flavor roll. The choices included the traditional flavors, pineapple, cherry, orange, lemon, and lime, and new flavors, raspberry, watermelon, blackberry, tangerine, mango, and melon/tangerine. The winners: Pineapple, cherry, raspberry, watermelon, and blackberry. Andrew Burke of Kraft Foods explained: "We said, 'Let's give [the customers] a chance to voice their opinion and help us pick the new face for a classic.' . . . Tastes change, and everything else changes." Source: "LifeSavers Introduces New Candy Flavors," National Petroleum News, 95 (October 2003), p. 11. customers. You may want to reformulate your soap to better meet their needs. If your performance does not meet your customers' expectations and there is a competitor that is more successful in meeting these expectations, and if you do nothing, you can expect your customer base to shrink. If your performance does not meet your customers' expectations and there is a competitor that is more successful in meeting their expectations, and if you do nothing, you can expect your customer base to shrink. Product SpaceYou can also detect design gaps by plotting the information in Exhibit 17.1 on a graph of what is known as product or service space (Exhibit 17.2). Each axis refers to a different benefit and shows how each competitor performs on that benefit. Usually you begin by plotting the positions of your organization and those of your competitors on the two most important benefits to your target customers. If there are other benefits you feel you need to examine, simply make a new graph with those pairs of benefits. There are ways to place more than two benefits on the same graph, but they are rather cumbersome. It is usually easier to graph just two benefits at a time and develop as many graphs as needed. Besides the positions of your organization and those of your competitors, you also locate the expected values for your target customers on the benefits. This point is known as the ideal point because it should describe the product or service that these customers would like to purchase. If you have the position closest to the ideal point for customers in a given segment, then you should be able to win that segment—if that benefit is important to the target customer and if the customer accurately perceives your performance on that benefit. Exhibit 17.2 Product or Service Space—Soap: Benefits 1 and 2 Benefit 2 Cleans Benefit 2 Cleans 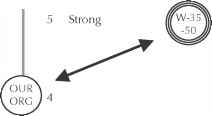
Design Gap Benefit 1 Moisturizes Design Gap Weak Benefit 1 Moisturizes Strong Strong 1 Weak Expected performance (ideal point). Actual performance. Expected performance (ideal point). Actual performance. Product Space—Soap Example In Exhibits 17.2 and 17.3, you can see how your soap compares with both what 35- to 50-year-old women want and what your competitors provide. In Exhibit 17.2, overall, your soap is closer to your target market's ideal point than any other competitor. There are two competitors, Q and S, that do better than you do on the "moisturizes" benefit but are not as good on the "cleans" benefit. You may want to consider filling your design gaps on both the Exhibit 17.3 Product or Service Space—Soap: Benefits 3 and 4 Benefit 4 Size 5 Large Benefit 3 Scent Weak Strong 1 Small Expected performance (ideal point). Actual performance. Expected performance (ideal point). Actual performance. "moisturizes" and "cleans" gap if it is possible—especially because competitors Q and S might be trying to improve their performance in regard to cleaning. The less important benefits are shown in Exhibit 17.3. You do reasonably well but could improve your position by cutting back on the scent in your soap. Product Space—Other Segments The Product Space Analysis can be expanded to help you evaluate whether you would like to try to design your product or service to appeal to other Exhibit 17.4 Product or Service Space—Soap: Other Market Segment Weak Benefit 2 Cleans 5 Strong 1 Weak Benefit 1 Moisturizes Strong Strong Expected performance (ideal point). Actual performance. market segments. To do that you would add to your graph the ideal points for the customers in the other segments. For example, Exhibit 17.4 includes the ideal point for 20- to 34-year-old-men who might have higher expectations for the cleaning power of a soap and not care much about moisturizing. Competitor T seems targeted toward them. You can do one more thing with the product space graph that will help you decide the positioning for your organization. You can make the areas of the Exhibit 17.5 Product or Service Space—Soap: Size of Market Segments 
Benefit 2 Cleans 5 Strong Weak 5 Strong 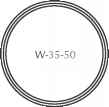
Benefit 1 Moisturizes Strong 1 Weak Expected performance (ideal point). ^^ Actual performance. Circles for expected performance in proportion to segment sales potential. circles showing the segment ideal points larger or smaller depending on the size of that market segment. In Exhibit 17.5, the market consisting of 35- to 50 -year-old women is shown as larger than the market consisting of 20- to 34-year-old men. Although size is not the only characteristic that makes a market attractive, the difference in sizes of the segments might persuade you to continue to target your soap to women, although you might consider developing another soap for men at some other time. |
Continue reading here: Sales Objectives
Was this article helpful?