Segment Selection Chart
The segment selection chart is a useful tool for developing your strategy, and you can make it even more valuable by adding more information. You can conduct the same analysis for each of your products and services, and summarize them all on the same chart. For example, if the real-estate agent were interested in expanding to services for commercial buyers involving, for example, office buildings or factory buildings, then those market segment opportunities could also be graphed on the same chart (Exhibit 10.3). That would provide an overview of all the market opportunities the realtor might pursue and information for allocating their resources.
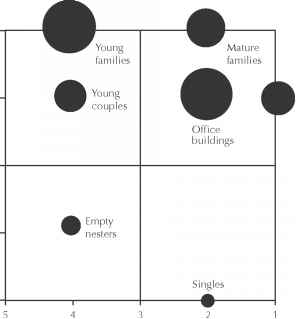
Rather than just locate a market segment on the segment selection chart, you can provide more information by making the circle bigger or smaller in proportion to the sales (or profits) you think that market segment represents over the next year or the next few years. Then you have an even more comprehensive picture of the choices available to you. For example, if the opportunities open to our realtor were those shown in
Exhibit 10.3 Segment Selection Chart with Real-Estate Segments— Residential and Commercial
Young Families
Young Couples
Empty Nesters
Mature Families
Factory ^
Office Buildings Buildings
Singles
Relative Ability
Note: Attractiveness: 1—Not attractive, 5—Very attractive Relative ability: 1—Weak, 5—Strong
Source: "Arrow Guide—Segment Selection Analysis," The Arrow Group, Ltd., New York, NY, 2008. Used here with permission.
Exhibit 10.4, it would be a major strategic decision to decide what to do about the market opportunities in the upper right-hand corner—all of them are very attractive and all would need resources if they were to be pursued.
The approach described in this chapter allows you to see all your opportunities at once, and that is its power. What you next need to do is choose those market segments that you think have potential for your organization. You can't choose them all so you need to choose the ones you think make sense.
Then for the segments you select, you need to develop a product/market strategy, including positioning and programs. You make the final selection of whether to go ahead when you forecast the sales and profits from your strategy (as covered in Chapters 35 and 37).
Exhibit 10.4 Segment Selection Chart with Real-Estate Segments—Residential and Commercial (Circles Sized in Proportion to Expected Sales of Total Market)
Factory buildings
Relative Ability
Factory buildings
Relative Ability
Note: Attractiveness: 1—Not attractive, 5—Very attractive Relative ability: 1—Weak, 5—Strong
Source: "Arrow Guide—Segment Identification Analysis," The Arrow Group, Ltd., New York, NY, 2008. Used here with permission.
Continue reading here: Sales Objectives
Was this article helpful?
