Deliverables for the Launch Milestone
1. Sales capability studies to examine the actual sales data versus sales forecast, the initial sales trend assessment, and the sales growth rate versus the plan
2. Customer identification and qualification metrics
3. Customer purchase experience and behavioral analysis
4. Customer satisfaction assessment
5. Sales process FMEA
6. Competitive assessment
7. Advertising and promotion effectiveness evaluation
8. Critical parameters update, including the SPC charts
9. Business case fulfillment assessment
10. The documented Manage phase control plan is approved and ready for use
The sample scorecard, as shown in Table 6.2 , is used by marketing gatekeepers who manage risk and make functional gate decisions for a specific project as part of the portfolio of projects being conducted by the marketing organization.
|
1 |
2 |
3 |
4 |
s |
6 |
|
SSFM Gate Deliverable |
Grand Average Tool Score |
% Task Completion |
Tasks Results Versus Deliverable Requirements |
Risk Color (R, Y, G) |
Key Milestone Requirements |
|
Marketing/sales capability study |
Show category revenue growth versus industry/actual sales versus forecast or initial plan/Cp and Cpk process metrics | ||||
|
Document customer identification/qualification metrics |
Produce a current market opportunity assessment that defines the market, segments, and targets | ||||
|
Customer purchase experience/behavioral analysis |
Develop and show process maps, channel analysis, category online shopping, and statistical analysis of emerging trends | ||||
|
Customer satisfaction assessment |
Develop a customer-perceived value analysis for each segment and specific targets within each segment | ||||
|
Sales and marketing process FMEA |
Show risk assessments for sales, marketing, technical/service, credit, distribution, communications, and so on |
|
1 |
2 |
3 |
4 |
s |
6 |
|
SSFM Gate Deliverable |
Grand Average Tool Score |
% Task Completion |
Tasks Results Versus Deliverable Requirements |
Risk Color (R, Y, G) |
Key Milestone Requirements |
|
Market perceived quality gap analysis, Won-Lost Analysis, benchmark summary |
Show a competitive assessment | ||||
|
Advertising and promotional effectiveness evaluation |
Show how awareness, consideration, trial, usage, and referral will be promoted and measured | ||||
|
Critical parameters update |
Show how CPM is fulfilling the control plan across critical sales and marketing processes | ||||
|
Business case fulfillment assessment |
Show the results of the plan against actual results (for line extensions) | ||||
|
Documented control plan and FMEA data |
Construct a control plan for post-launch marketing and sales processes with risk assessment |
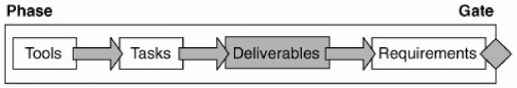
Columns 1 and 6 align the gate deliverable to a gate requirement. Each deliverable is justified as it contributes to meeting a gate requirement. (Never produce a deliverable if you can't justify its ability to fulfill a gate requirement.)
Grand Average Tool Score (GATS) illustrates aggregated tool quantification across the three scoring dimensions. (A high GATS indicates that a group of tasks is underwriting a gate deliverable.)
% Task Completion is scored on a 10 to 100% scale. This measure is critical if you want to understand how completely a group of related tasks are fulfilling a major gate deliverable.
Color coding illustrates the nature of the risk accrual for each major deliverable within this phase of the process. Color code risk definitions (red, yellow, and green) are found in Chapter 2 .
Continue reading here: Define Step Tools Tasks and Deliverables
Was this article helpful?
Readers' Questions
-
katharina1 year ago
- Reply